New analysis of the Category 2 budget utilization from FY2015 to FY2019 yields important new insights. The current budget floor is too low, and adjustments need to be made to the per student and per square foot budget factors.
Current Budget Floor is Too Low
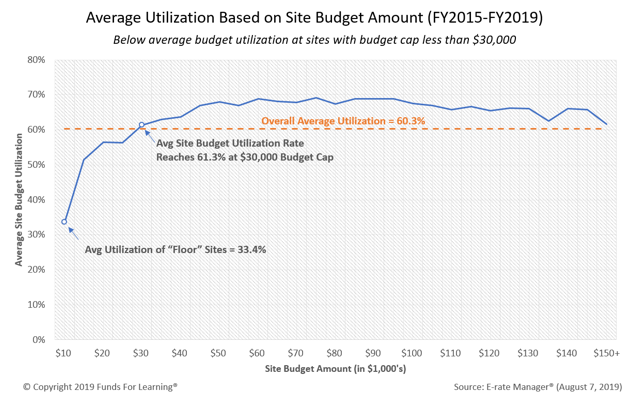
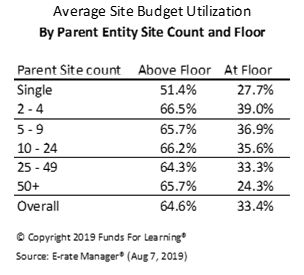
Nationwide, the average budget utilization from 2015 to 2019 was 60.3%; however, for small sites – those that only qualify for the budget floor of $9,793 – the average utilization rate was 33.4%, nearly half the normal utilization rate.
The chart below shows the average utilization rate for each of the various site budget levels, starting at the budget floor and continuing up to $150,000. The utilization of site budget drops significantly for sites with budget amounts set below $30,000.
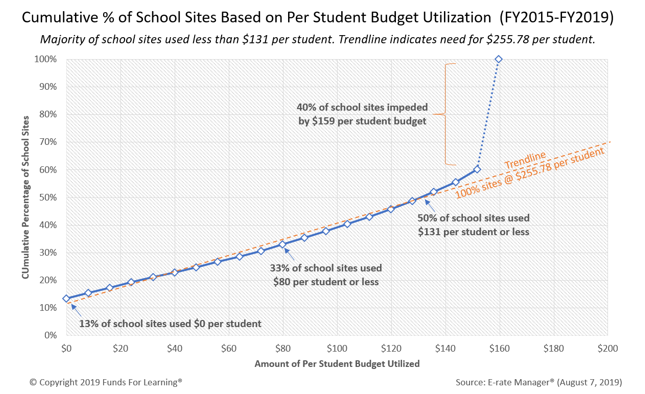
Per Student Factor Should be $255.78
Funds For Learning reviewed the amount of budget utilized at each school site from 2015 to 2019. Below the budget cap of $159, there is a consistent distribution of school budget utilization. The following chart illustrates the running percentage total of school sites based on the amount of budget that was utilized as calculated on a per student basis. For example, 33% of sites used $80 per student or less of their budget. 50% of sites used $131 per student or less. The slope of this line is consistent until it reaches the $159 per student cap at which point it jumps dramatically. This jump is the result of the budget cap.
Library Factor Should be Increased Slightly
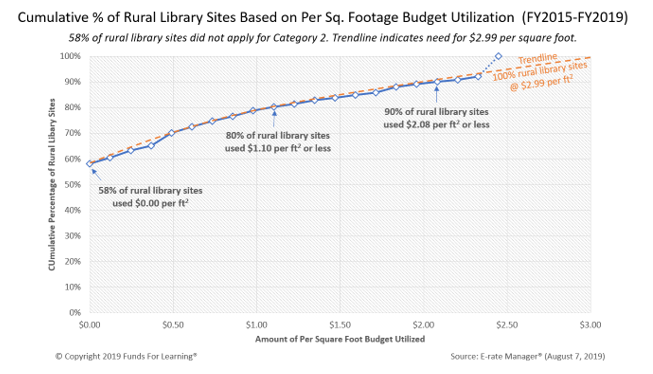
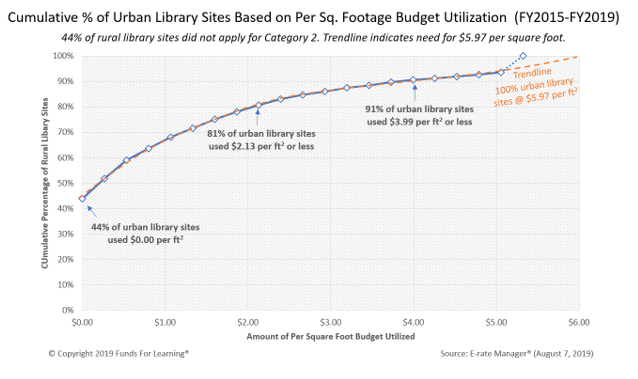
Library budget utilization data from 2015 to 2019 yields similar, yet less pronounced results. Although most libraries did not fully utilize their C2 budget, the demand curve suggest that a small percentage of libraries would have benefited from a slightly higher per square foot budget cap.
- For rural libraries, the cap should be set at $2.99 per ft2 to meet current demand.
- For urban libraries, the cap should be set at $5.97 per ft2 to meet current demand.