The annual demand for E-rate discounts has exceeded available funding every year of the program since 1998. To account for this, the FCC prioritizes funding requests by service category and then applicant discount rate. Priority One services are telecommunications and Internet access. Priority Two services are internal connections and basic maintenance of internal connections. For example, a wealthy school will receive discounts for its Internet access (i.e. Priority One service) before a more impoverished school will receive funding for Wi-Fi Internet access (i.e. Priority Two equipment.)
Within a Priority band, applicants qualifying for the highest E-rate discount rate have first dibs on funding commitments. When the available funding is exhausted, applicants with lower discount rates are denied funding altogether. In any given funding year, total E-rate demand can be calculated by the following formula. (P1 = Priority One services; P2 = Priority Two services):
Total Demand = P1 90% + P1 89% + P1 88% + … + P2 90% + P2 89% + P2 88% + … P2 20%
The following graph illustrates this equation, as a percentage of the annual E-rate funding cap, for each of the past four funding years.

NOTE: This graph reflects the relationship between total demand and the annual funding cap excluding the rollover of unused funding commitments from prior years. This graph highlight the relationship between the demand for funds and the funding cap.
A survey of the graph provides several important findings. Without the rollover of unused funds:
- In FY2010, the funding cap would have been adequate to fund only the Priority One funding requests.
- In FY2011, the total demand for support equaled 204% of the funding cap.
- In FY2012, all P2 funding and P1 requests below the 44% discount rate would have been denied.
- In FY2013, demand for all P1 services and P2 services at the 90% discount rate totaled 191% of the funding cap.
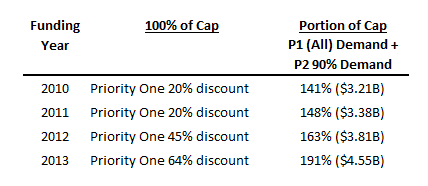
The following table includes (A) the point in each funding year that 100% of the cap was reached, and (B) the portion of the cap represented by the sum of the P1 demand and the 90%-discount P2 demand.
Based on the current growth in P1 demand, Funds For Learning estimates that the discount threshold for P1 support in FY2014 and FY2015 will be 75% and 80%, respectively. (See Exhibit B page 2 of the Reform Coalition NPRM Comments.)