On May 16, 2014, Funds For Learning® submitted our FY 2014 P1 Demand Analysis to the FCC, a report on current school spending for telecommunications services and Internet access. Our analysis was designed to help answer two fundamental questions:
- What do schools spend each year on telecommunications and Internet access?
- What drives cost variations between schools?
E-rate funding applications provide a clear window into school spending. But discovering the underlying factors that influence costs is a much harder question to answer. Over the course of the next month, Funds For Learning® will begin to tackle the questions above via a four-part series that dives deeper into our analysis, shedding light on the data and debunking several E-rate myths along the way.
Part 1 – State-to-state Comparisons
Per student spending for telecommunications and Internet access averages $55.55 per year, nationwide, with the vast majority of schools spending at least $30 and no more than $80 per student. Grouping schools by state, shows a similar distribution, with no clear pattern as to why costs vary from state-to-state.
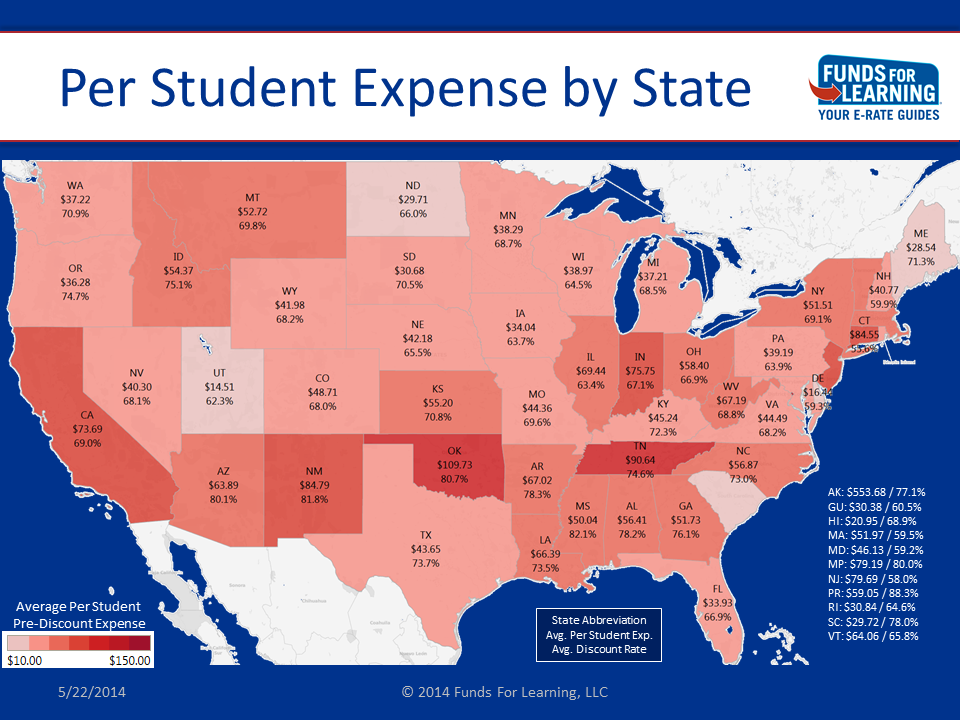
For example, there are “urban” states with average school expenses that fall throughout the spectrum from $30 to $80 per student. Florida and Pennsylvania schools fall in the lower range; New York and Ohio are in the mid-range; and California and New Jersey fall towards the top. Similarly, there are “rural” states in which average expenses fall below the national norms, and others where they exceed those norms. The presence of statewide or regional communications networks may drive costs lower in some states, either directly (via lower rates paid by schools) or through consortium applications (not included in this analysis).
Interestingly, graphing the distribution of per student expenses by state shows a clear normal-type distribution that is slightly skewed with a tail that extends outward towards higher per student costs.

Eleven states or territories fall outside the $30-to-$80 range. Six below: Delaware, Hawaii, Maine, North Dakota, South Carolina, and Utah; and five above: Alaska, the District of Columbia, Oklahoma, Tennessee, and the Virgin Islands.
Alaska is a category all of its own. As illustrated below, the per student expense of telecommunications and Internet access in Alaska appears fundamentally different than that of the other states.

The distribution of costs in most states is centered on the national average of $55.55 per student plus or minus a certain amount. But Alaska is clearly an outlier. Its schools spend, on average, an amount per student that is an order of magnitude (10X) higher than the rest of the nation.
Conclusion
In most cases, the state in which a school resides does little to help us predict their telecommunications and Internet access expenses. However, schools in Alaska clearly operate under a very different set of circumstances. This data suggest that as FCC regulators consider new rules for the E-rate program they may want to steer away from approaches that “bend” to include Alaska schools. Instead, given the huge disparity in costs, the FCC may want to consider a completely different approach for the 49th state.
Next Week: Part 2 of our analysis will look at the impact of E-rate discount rates on school expenditures.