On May 16, 2014, Funds For Learning® submitted our FY 2014 P1 Demand Analysis to the FCC, a report on current school spending for telecommunications services and Internet access. Our analysis was designed to help answer two fundamental questions:
- What do schools spend each year on telecommunications and Internet access?
- What drives cost variations between schools?
E-rate funding applications provide a clear window into school spending. But discovering the underlying factors that influence costs is a much harder question to answer. Over the course of this month, Funds For Learning® resolved to tackle the questions above via a four-part series that dives deeper into our analysis, shedding light on the data and debunking several E-rate myths along the way. In the fourth and final installment of this series, we go deeper than just identifying trends by looking into the underlying patterns that exist within them.
Part 4 – Looking for trends within the trends
We have seen that applicant size is the biggest predictor of out-of-pocket per student expenses for telecommunications and Internet access. Applicants with more sites and more students generally pay less per student, regardless of their location or E-rate discount percentage. Similarly, single schools and small school districts have the highest out-of-pocket expenses. The chart below shows the monthly per student out-of-pocket telecommunications and Internet expenses paid by schools based on their size and location. The points on the graph represent the median monthly expense and discount rate for school applicants of all sizes and location types.
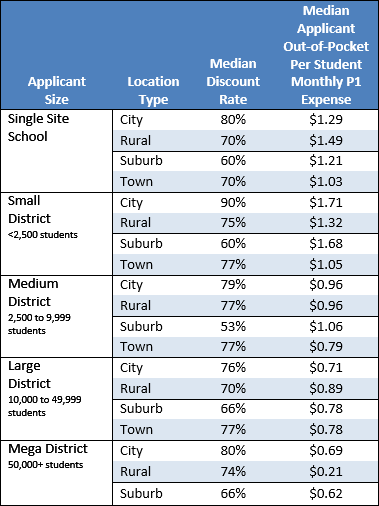
(Click for detailed chart)
Conclusion
Applicant size by student count appears to be a reliable factor for determining where an applicant will fall within the spectrum of per-student costs for E-rate eligible services. Large school districts continue to show lower costs than smaller applicants, regardless of discount rate, or location. As we saw in Part 3 of our analysis, costs are driven down by size, with scalable fixed costs being leveraged by larger districts. Suburban applicants follow this trend as well, with generally lower discount rates.