According to E-rate funding applications, the average speed of broadband to school and library buildings has more than doubled since 2016, while the average price paid per megabit has dropped more than half. New options for broadband connectivity, including self-provisioned networks, and an increase in the number of available service providers are both factors driving this dramatic change.
###
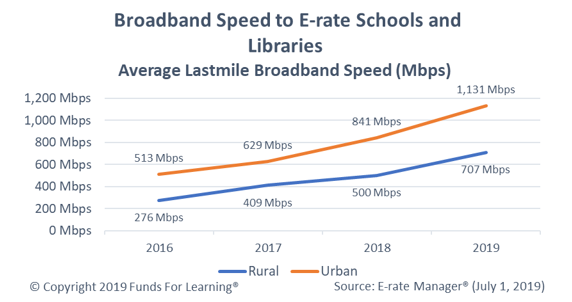
In 2016, rural schools reported an average “last mile” broadband connection speed of 276 megabits per second (Mbps). For the same period, urban schools reported an average connection speed of 513 Mbps. Now, in 2019, these speeds have more than doubled. Rural sites now have an average speed of 707 Mbps, more than 2.5 times faster than 2016. Urban sites now average 1,131 Mbps, 2.2 times faster than 2016.
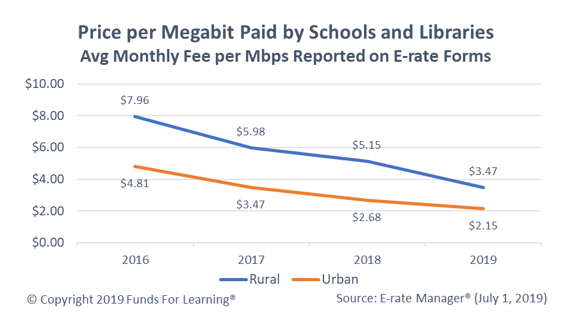
Remarkably, this dramatic increase in bandwidth has cost applicants (and the E-rate program) very little money. The average monthly fee per megabit of download speed has dropped almost as much as the bandwidth being delivered has increased. In 2016, rural applicants paid an average of $7.96 monthly per Mbps of download speed. For urban applicant, the average fee was $4.81 per Mbps of download speed. Now, in 2019, the amount paid by rural and urban schools average $3.47 and $2.15 per Mbps, respectively.
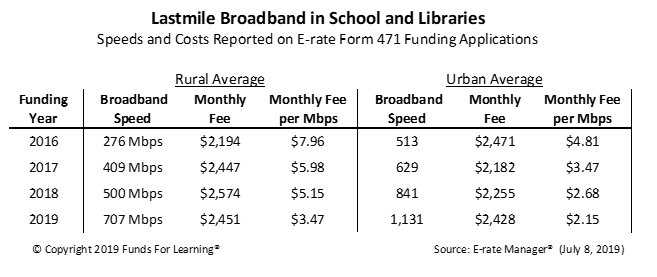
The net effect is that both rural and urban schools are receiving much faster connections for about the same money, or a little more, each month. The table below shows the average broadband speed, total monthly fee, and net monthly fee per Mbps for urban and rural schools
Increased Competition Drives Improvements
Competition appears to be a significant driver behind the faster connection speeds and more cost-effective pricing.
A significant portion of applicants report that their price per megabit has decreased because of the option to procure self-provisioned networks. In a nationwide survey of applicants just completed by Funds For Learning, 26% of applicants reported that self-provisioned networks resulted in lower prices for their school or library system, regardless of whether or not they purchased such a network.
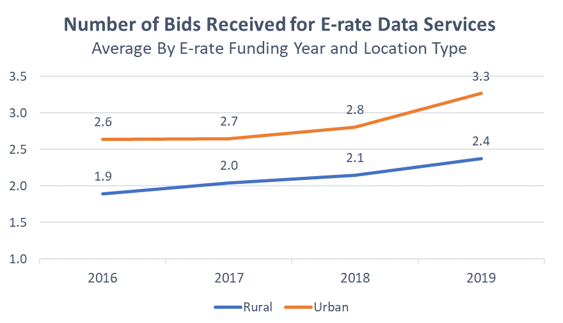
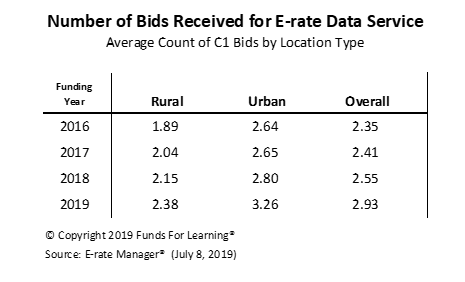
This has helped foster an an environment that encourages more vendors to submit bids to provide services to schools and libraries. Since 2016, the average number of bids received for Category One data services has increased 25%. In 2016, applicants received an average of 2.35 vendors bids for their data services. In 2019, applicants received an average of 2.93 vendor bids for their data services. Importantly, both urban and rural applicants have benefited from an increase in competition for their business.
About the Calculations
The rural and urban status of an applicant is based on the geographic location of each individual site as reported on E-rate Form 471 applications. For purposes of this analysis, an entity is rural if a majority of its sites have a rural designation.
The average broadband speed and monthly fee is based on the description of service detail data provided by the applicant on each year’s Form 471 funding application(s). Only data transmission services designated as “last mile” have been included. The speeds and fees listed do not include Internet access-only (no transport) fees or miscellaneous charges.
The average number of Category One bids excludes voices services.
All data was downloaded from E-rate Manager® on July 1, 2019.